
Every restaurant business makes hundreds of decisions every single day. From tracking inventory and scheduling staff to optimizing menus and protecting profit margins.
The problem is not the lack of data. It is the lack of clarity. Here is the number that puts it into perspective. Data-driven restaurants have a 23% higher survival rate than those running on gut instinct alone.
In an industry where average profit margins sit between 3% and 9%, that is not a small edge. That is the margin between a restaurant that scales and one that shuts down.
Restaurant data analytics is the practice of collecting, analyzing and acting on the functional, transactional and customer data your restaurant produces every single day. When used as a powerful tool for business decisions, it shapes everything from which menu items stay on the card to how many staff you schedule on a slow day. Additionally, which guests are worth a targeted win back campaign.
This guide breaks it all down, with the numbers to back every call.
What is Restaurant Data Analytics?
Restaurant data analytics is the process of turning everyday data into clear business decisions. It pulls data from multiple sources:
- POS systems
- Inventory tools
- Online orders and delivery apps
- Customer feedback and loyalty programs
- Staff scheduling systems
Then data analytics connect the dots. It studies what happened & why did it happen? Additionally, it suggests what to do next.
What Data Do Restaurants Actually Collect?
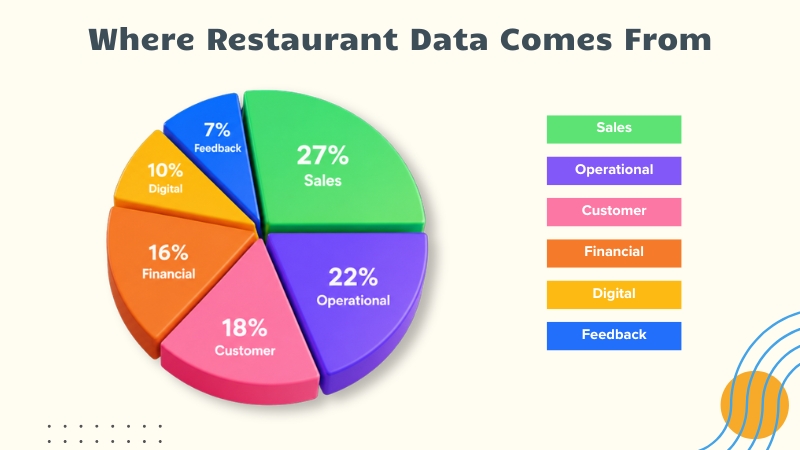
The average full-service restaurant pulls data from at least six sources every single day. Most operators are actively using two of them.
Restaurants that connect all six of these into a single view catch profitability problems before they appear on the monthly P&L. However, restaurants that do not are always one bad week away from a surprise.
Bringing all of this together requires a solid data engineering foundation. Without it, each source stays isolated and the insights stay invisible.
Here is the full picture of what is available right now inside your business:
- Customer data: dining history, visit frequency, loyalty activity, food preferences and post-visit feedback
- Sales data: item-level transactions, hourly revenue, average order value, table turnover time and peak period patterns
- Operational data: inventory levels, waste logs, kitchen throughput, order accuracy rates and staff hours per shift
- Financial data: cost of goods sold, prime cost ratio, food cost percentage, labor cost percentage and net margin by day
- Digital data: online ordering behavior, delivery platform performance and website traffic patterns
Feedback data: review sentiment across Google, Yelp and TripAdvisor, plus satisfaction survey scores
The 4 Types of Restaurant Data Analytics Explained
Restaurant data analytics is not a single activity. It works across four levels. Most independent restaurants are only operating at the first one.
The restaurant groups gaining ground in 2026 are running at all four levels simultaneously. Most independents are still reading last week’s sales report and calling it analysis.
| Area | Without Analytics | Restaurant With Analytics |
|---|---|---|
| Menu | Guess what sells | Know top profit items |
| Inventory | Over-order or stockouts | Precise demand planning |
| Staffing | Fixed schedules | Demand-based scheduling |
| Marketing | Generic campaigns | Targeted promotions |
What are the most important restaurant analytics metrics and KPIs to track?
Tracking the right numbers is the difference between running a restaurant and understanding one. Most operators track revenue and food cost. That is a start. But it leaves out the metrics that actually explain why profit is shrinking, where service is breaking down, and which customers are quietly walking away.
Here are the numbers that matter.
1. Sales Metrics: Average Order Value, Revenue per Cover, Daily Trends
These three tell you how efficiently your restaurant converts footfall into revenue.
Average Order Value (AOV) is total revenue divided by the number of orders. A $2 increase in AOV across 200 daily covers adds $400 a day. That is $146,000 a year without a single new customer.
Revenue per Cover measures how much each seated guest spends on average. It separates high-performing shifts from underperforming ones even when cover counts look identical.
Daily sales trends reveal patterns invisible in monthly totals. A restaurant averaging $8,000 a day might be hitting $12,000 on Fridays and $4,200 on Mondays. That gap drives every staffing, inventory, and marketing decision.
2. Cost Metrics: Prime Cost, Food Cost Percentage, Labor Cost Ratio
These are the metrics where most restaurant profitability is either protected or lost.
- Prime cost is the sum of food cost and labor cost. The industry benchmark sits at 55% to 65% of total revenue. Anything above 65% and margins are under serious pressure.
- Food Cost Percentage is the cost of ingredients divided by revenue from those items. The target range for most full-service restaurants is 28% to 35%. A single percentage point above target on $1 million in annual revenue is $10,000 in lost margin.
- The labor cost ratio measures total labor spend as a percentage of revenue. The industry average sits at 30% to 35%. Restaurants using predictive analytics for scheduling have reduced this by 3% to 5% points without cutting service quality.
3. Customer Metrics: Visit Frequency, Retention Rate, Guest Lifetime Value
These are the metrics most independent restaurants never measure. They are also the ones with the highest revenue upside.
- Visit frequency tracks how often a guest returns within a set period. Guests who visit three or more times in 90 days spend 67% more per visit than first-time visitors.
- Customer retention rate measures the percentage of guests who return after their first visit. The restaurant industry average sits at around 30%. Increasing it by just 5% can boost revenue by 25% to 95% depending on your average spend per visit.
- Guest Lifetime Value (GLV) calculates the total revenue a guest generates across their entire relationship with your restaurant. Loyal guests spend up to 10 times more than one-time visitors over their lifetime. Most restaurants invest heavily in acquiring new customers and almost nothing in retaining existing ones.
4. Operational Metrics: Table Turnover, Kitchen Throughput, Wait Times
These metrics live between the front of house and the back of house. They are where service quality and profitability intersect.
- Table Turnover Rate is how many times a table is seated per service. Increasing turnover from 2.5 to 3.0 times per evening on a 40-cover restaurant adds 20 additional covers per night. At an average spend of $45, that is $900 in additional nightly revenue.
- Kitchen throughput measures how many orders your kitchen processes per hour at full capacity. When throughput drops below demand, ticket times rise, reviews suffer, and cover decline.
Wait Times directly correlate with guest satisfaction scores. Research shows that every additional 5 minutes of wait time above expectation reduces the likelihood of a return visit by 11%.

How Data Turns Your Menu From a List of Dishes Into a Margin Machine?
Your menu is your most important profitability lever. Most operators design it around preference and habit. The ones hitting consistent margins design it around data.
What Menu Engineering Actually Is?
Menu engineering analyzes every item across two dimensions: how popular it is and how profitable it is.
Popularity tells you what guests order. Profitability tells you what those orders are actually worth to your business.
Without connecting both, you are making menu decisions with half the picture.
Every item on your menu falls into one of four positions. Here is how to think about each:
| Category | Popularity | Profitability | Action |
|---|---|---|---|
| Stars | High | High | Protect and promote |
| Plowhorses | High | Low | Reprice or reduce ingredient cost |
| Puzzles | Low | High | Improve visibility |
| Dogs | Low | Low | Remove or replace |
When restaurants run this analysis honestly, one pattern appears almost every time. Around 20% of menu items generate 80% of profitable revenue. The remaining 80% consume kitchen time, inventory spend, and staff attention while contributing very little to the bottom line.
Pricing with Data: The Shift From Once a Year to Every Single Day
Most restaurant pricing decisions happen once a year during a menu refresh. A few percentage points added across the board. Maybe a new item priced by feel.
That approach made sense when data was hard to access. It does not make sense anymore.
What Dynamic Pricing Actually Means for Restaurants
Dynamic pricing adjusts menu prices based on demand signals: time of day, day of week, seasonal patterns, and current inventory levels. It is not surge pricing and also not penalizing guests for showing up on a busy night.
It is charging the right price at the right time, backed by data that tells you exactly when guests are price-sensitive and when they are not.
The Numbers Behind It
- Peak period guests are significantly less price-sensitive. A Friday 8 PM booking carries different demand dynamics than a Tuesday lunch.
- A 10% price reduction during off-peak hours can lift cover count by 15% to 20%.
- Item-level pricing adjustments on high-demand dishes during peak service can lift revenue per cover by 6% to 9% without affecting satisfaction scores.
- As of 2025, 13% of restaurant chains are actively using AI-driven dynamic pricing. That number is growing fast.
Where Most Restaurants Get This Wrong
Blanket price increases without data push guests away. Data-backed pricing adjustments are largely invisible to the guest and highly visible on the P&L. The difference is not the pricing decision. It is the data behind it.
What the Leading Chains Are Doing With Their Data?
Most independent operators assume data analytics is a large chain advantage. The reality is different. The chains are not winning because they have more data. They are winning because they built systems to act on it faster.
Here is what that looks like in practice.
- Dunkin Used item-level sales analytics to identify underperforming menu items and cut them. Fewer items meant simpler operations, faster service, lower food cost, and stronger per-location profitability. The menu got smaller. The margins got better.
- Sweetgreen Built a centralized analytics system connecting app behavior, in-store POS data, and marketing performance into one view. The goal was simple: identify which menu items drive repeat visits versus one-time orders and engineer the menu around that insight. Guest retention improved. Marketing spend became more precise. Restaurants often combine these insights with branding improvements, such as refining their visual identity through an AI logo generator to maintain a consistent customer experience across digital and physical channels.
- McDonald’s Created a dedicated Chief Data, Analytics and AI Officer role at the C-suite level in 2024. Not a technology role. A business strategy role. The signal was clear: data-driven decision making is now a core operational function, not an IT project.
The pattern behind all three
None of them started with AI. They started with connected, clean, reliable data. The analytics capability came after the data infrastructure was in place.
That sequence matters. Restaurants deploying AI tools on top of fragmented, disconnected data systems get dashboards that look impressive and deliver very little. Restaurants that build the data foundation first see results within 90 days.

Conclusion
Most restaurants are not losing money because of bad food or poor service. They are losing it because decisions that should be driven by data are still driven by habit.
Your POS, inventory, customer, and financial data is already there. It is already telling you where margins are slipping, where guests are leaving, and where labor is running high. The problem is that nobody is listening to it in a connected, systematic way.
That is the problem restaurant data analytics solves. The restaurants pulling ahead right now are not the biggest ones. They are the ones acting on their numbers faster than everyone else.